

Flooding in District 1
Belle Haven and the Bayfront sit at the edge of San Francisco Bay, beside the marshes and salt ponds of the baylands. That makes District 1 the part of Menlo Park most exposed to flooding, from heavy rain and from the Bay itself. This winter’s forecast makes it worth getting ready now. This page is kept up to date through the season.
The latest forecast
Updated September 24, 2026A very strong El Niño is expected this fall and winter.
- Better than 90% chance of a very strong El Niño through the fall and winter.
- 75% chance that from October to December it is the strongest since records began in 1950.
- The odds favor a wetter-than-normal winter across California, highest near the coast from December through April (50–60%). NOAA says those odds may go up in its next outlook.
A strong El Niño makes heavy storms more likely here, not certain. In NOAA’s own words, the chances of El Niño’s usual effects are “larger, though not guaranteed.”
Sources: NOAA Climate Prediction Center, El Niño discussion (September 10; next October 8) and seasonal outlook (September 17; next October 15). Day-to-day forecasts and flood warnings: National Weather Service, Bay Area.
When the Bay comes up
King tides are the highest predicted tides of the year. They come when the sun, moon and Earth line up and the moon is at its closest, and they are strongest in winter, when Earth is also closest to the sun. They are natural and predictable, and a storm at the same time pushes the water even higher (Coastal Commission).This winter: November 24–26, December 23–25 and January 21–22, 2027.
Look up the next ones: the King Tides tide map or NOAA’s Redwood City tide predictions.
Photos by volunteers for the California King Tides Project, except Hamilton Ave (City of Menlo Park).
What is your flood risk?
Enter a District 1 address to see its flood zone on FEMA’s map, or tap anywhere on the map. Your address is not saved.
Tap anywhere on the map to check that spot.
Why Belle Haven floods
Belle Haven is low and flat, and much of District 1 was once bay marsh. Water reaches it two ways. Heavy rain can fill the storm drains faster than they empty. And the Bay itself can push in at high tide. The regional flood agency that serves Menlo Park and East Palo Alto says plainly that Belle Haven is “vulnerable to flooding today from a 100-year tide event.”
El Niño raises the Bay, not just the rainfall. In the strong El Niño winter of 1997–98, the U.S. Geological Survey found, the high tide at the Golden Gate on February 3, 1998 ran about two feet higher than the tide tables predicted, and low-lying areas around the Bay flooded.
The riskiest days are when a storm lands on a king tide, the highest tides of the year. This winter they fall on November 24–26, December 23–25 and January 21–22, 2027. Watch for coastal flood advisories from the National Weather Service around those dates.
Flood zones: about 1 in 3 homes is high risk
FEMA’s flood map puts 351 of District 1’s roughly 1,106 homes (32%) in Zone AE, the high-risk area with at least a 1% chance of flooding every year, often called the 100-year floodplain.
The high-risk homes are on the Bay side of Belle Haven: all of Sandlewood St, Rosemary St, Sage St, Ginger St, most of Hamilton Ave and Terminal Ave, and parts of Carlton Ave, Madera Ave, Sevier Ave, Hollyburne Ave, Windermere Ave, Henderson Ave, Chilco St. There, FEMA sets the “base flood elevation” at 11 feet: how high water would rise in a 100-year flood, measured from a survey baseline near sea level. It is a height, not a depth. How deep the water would get at a home depends on how high its ground and floor sit, which an elevation certificate shows; the City may have one on file for your home. Streets in the district’s smaller neighborhoods, such as Menlo Oaks, Plumas Ave and Del Norte Ave, are in minimal-risk areas.
How we counted: FEMA’s current flood map (the National Flood Hazard Layer) laid over San Mateo County parcel lines, counting homes inside the District 1 boundary by the zone at the center of each lot. It shows where homes fall on the map, not a ruling for any one property. Look up your own address with FEMA.
What the flood zone means for you
- If you have a federally backed mortgage on a home in Zone AE, your lender requires flood insurance (FEMA).
- Anyone can buy flood insurance, homeowners and renters alike, in any zone. Most home and renters policies do not cover flooding.
- Buy before the rain. A new federal flood insurance policy usually takes 30 days to start (National Flood Insurance Program). The City explains the rules on its flood insurance page.
Get ready now
Before the storms
0 of 5 done
During a storm
- Stay out of floodwater. Never drive or walk through a flooded street.
- If you are told to evacuate, go.
- Call 911 only when someone’s life is in danger. For everything else, use the numbers below.
After the water goes down
- Photograph any damage before you clean up, and call your insurer.
- Sandbags that sat in floodwater can carry sewage or chemicals. Wear gloves to handle them.
Who to call
- Blocked storm drains, street flooding, levee damage, fallen trees, sandbagsCity of Menlo Park Public Works · Mon–Thu 7:30am–5:30pm, every other Fri 8am–5pm(650) 330-6740
- After hours, for problems that can’t waitMenlo Park Police, non-emergency line(650) 330-6300
- Power outages and gas leaksPG&E1-800-743-5000
- Sewer problemsWest Bay Sanitary District(650) 321-0384
- Fire questions that are not emergenciesMenlo Park Fire Protection District(650) 688-8400
- General questions, by textCity of Menlo ParkText(650) 679-7022
The long-term fix: SAFER Bay
SAFER Bay is the regional project to protect Belle Haven, the Bayfront and East Palo Alto from Bay flooding and sea level rise. In Menlo Park it would use levees, floodwalls and restored marsh along 3.7 miles of shoreline. Its environmental review was certified on May 28, 2026. Three sections in Menlo Park are being designed now, work the City expects to finish in spring 2027, along with one in East Palo Alto (all four marked below). Construction follows once full funding is secured.
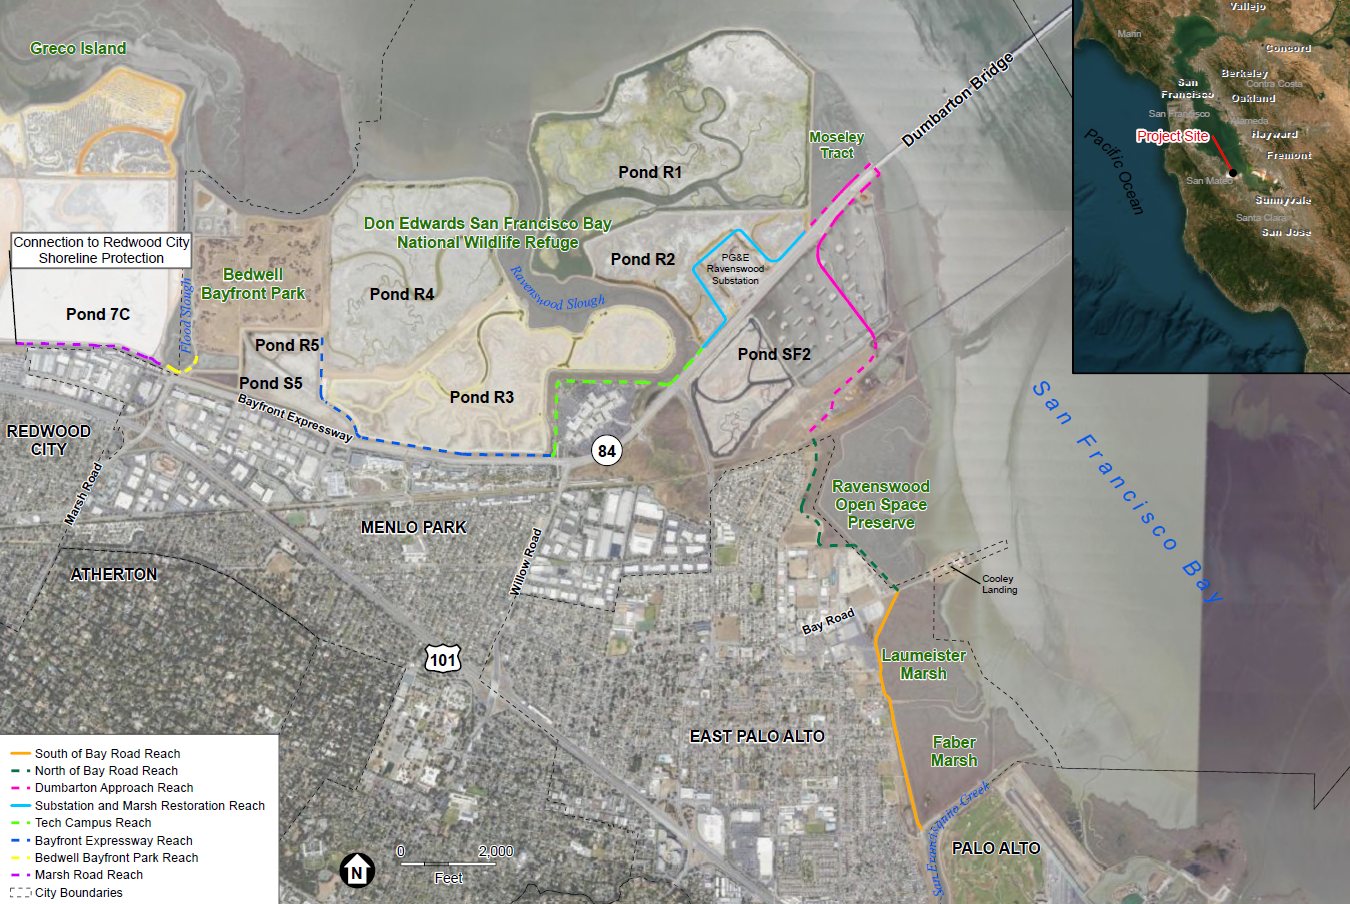 Map of the SAFER Bay levee sections along the Menlo Park and East Palo Alto shoreline. Opens full size.
- Marsh Road · Menlo Park and Redwood CityA levee on private land by the Redwood City line.
- Bedwell Bayfront Park · Menlo Park and Redwood CityA levee at the park, with the Bay Trail extended west.
- Bayfront Expressway · Menlo ParkBeing designed nowA levee along the Expressway, then north between the ponds to Bedwell Bayfront Park, with a trail on top.
- Tech Campus · Menlo ParkBeing designed nowA levee and floodwall along the Meta campus shoreline, and a new pump station in Ravenswood Slough.
- Substation and Marsh Restoration · Menlo ParkBeing designed nowA levee around PG&E’s Ravenswood substation, which serves almost 300,000 customers. Pond R1 and part of R2 return to tidal marsh.
- Dumbarton Approach · Menlo ParkA levee through Pond SF2 and a floodwall along Highway 84 at the bridge.
- North of Bay Road · East Palo Alto and Menlo ParkA levee by the Ravenswood Open Space Preserve, with a floodgate at the railroad tracks.
- South of Bay Road · East Palo AltoBeing designed nowA levee and floodwall along East Palo Alto’s shoreline, with a floodgate at Bay Road.
On the map, solid lines are the sections the environmental review studied in full detail. Dashed lines were studied in less detail and need more review before they can be built.
When it is finished, the City expects that a substantial part of Belle Haven and the Bayfront could come off FEMA’s 100-year coastal flood map. The City is asking for community input on the design over the next year; you can sign up for project updates.
Sources (32)
- NOAA National Ocean Service — What are El Niño and La Niña?
- NOAA Climate Prediction Center — ENSO Diagnostic Discussion (Sept. 10, 2026)
- NOAA Climate Prediction Center — 90-day outlook discussion (Sept. 17, 2026)
- National Weather Service — San Francisco Bay Area
- U.S. Geological Survey — El Niño Sea-Level Rise Wreaks Havoc in California's San Francisco Bay Region (Fact Sheet 175-99)
- California Coastal Commission — King Tides Project
- California King Tides Project — photo gallery (shoreline photos on this page)
- California Coastal Commission — What are King Tides?
- KTVU — Menlo Park flooding near Meta prompts possible evacuations (Dec. 24, 2025)
- City of Menlo Park on Facebook — Hamilton Ave. flooding resolved (Dec. 24, 2025; photo on this page)
- NOAA Tides & Currents — Redwood City tide gauge 9414523 (water levels; highest since 1997 on Jan. 3, 2026)
- NOAA Tides & Currents — Redwood City tide predictions
- FEMA — National Flood Hazard Layer
- FEMA — Zone AE (glossary)
- FEMA Flood Map Service Center — look up an address
- National Flood Insurance Program — buy a policy (who can buy, what's covered, 30-day wait)
- National Flood Insurance Program — homeowner checklist (take a household inventory)
- National Flood Insurance Program — document damage after a flood
- Ready.gov (FEMA) — Floods
- Ready.gov (FEMA) — Build a kit
- City of Menlo Park — Storms and flooding
- City of Menlo Park — Sandbags
- City of Menlo Park — Evacuation zones
- City of Menlo Park — Flood insurance
- City of Menlo Park — SAFER Bay project
- San Francisquito Creek Joint Powers Authority — SAFER Bay project
- SFCJPA — SAFER Bay draft EIR public meetings, December 2025 (levee map and section details)
- SFCJPA — SAFER Bay draft EIR public meetings, December 2025, in Spanish
- Bay Conservation and Development Commission — SAFER Bay engineering review staff report (June 22, 2026)
- FEMA — Menlo Park SAFER Bay Project (the substation’s ~300,000 customers)
- County of San Mateo — SMC Alert
- PG&E — outage map
Official sources are in English. Source titles are left in their original language.