

Loading the 3D city…
Menlo Park · Housing plan 2023–2031
Can you make Menlo Park’s housing plan work?
The state mandates that Menlo Park plan for 2,946 new homes by 2031, at every income level. Choose where they could go on the plan’s 68 real sites.
Map style
About the simulator
This is a model of Menlo Park you can play with, built from real data. On it are the 68 sites in the city’s housing plan. Your job: zone enough of them so there are homes for every income level.
Built from real data
- Buildings at their measured heights, where known
- The city’s own street trees
- Traffic lights where they really are
- Caltrain on its real schedule
- Today’s weather
How to play
- Press Playand read your mission.
- Zone the sitesTap a site on the map, or open Sites. Choose how many homes, and for which incomes.
- Watch the metersThe four meters at the top fill up. A check mark means that income level has enough.
- Try the switchesWhat if Measure P passes? With or without Willow Village? With 80 Willow?
- Finish and shareSee how many stars you earned, then save your plan and share the link.
Map styles
Pick one from the menu (☰) once you’re playing.
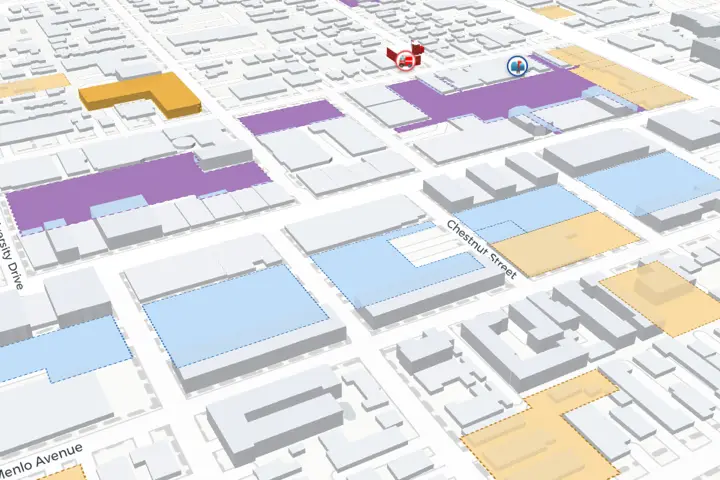 Plain mapLight and quick, the starting style on phones.
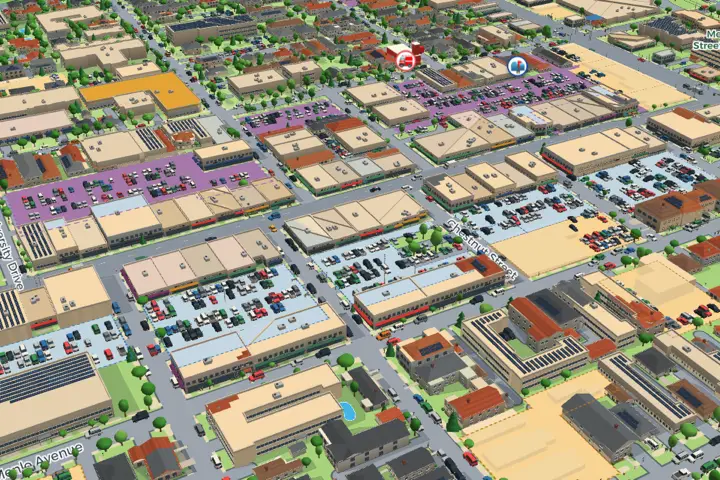 GreenThe 3D city, with its trees, cars, people and buildings.
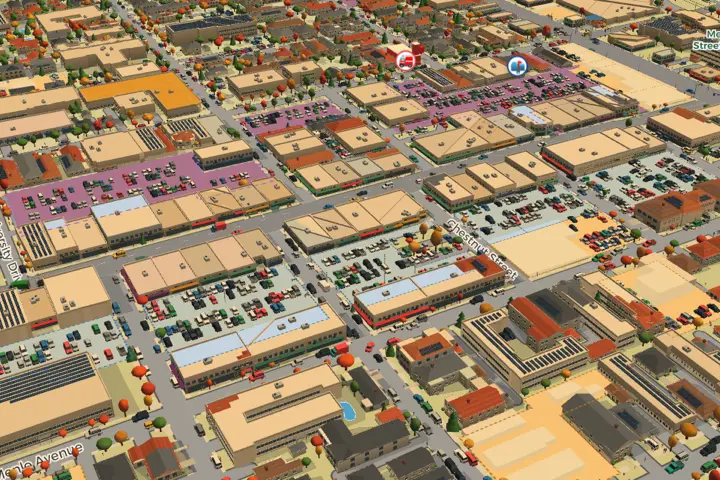 AutumnThe street trees that really change color in the fall turn orange and red.
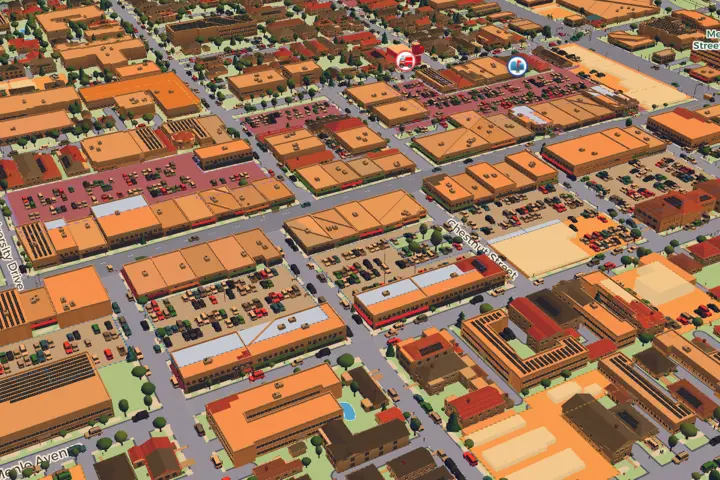 RealtimeFollows the real sun and Menlo Park’s weather right now.
The same downtown view in each style, with Realtime at sunset. Map © CARTO, © OpenStreetMap contributors.
Things to look for
- A coyote in the BaylandsIt roams Bedwell Bayfront Park, out by the bay, with egrets along the shore.
- Caltrain, on its real scheduleWeekday and weekend trains, and the crossing gates coming down. Press Train to send one into Menlo Park station; the speaker button turns the sound on.
- Planes overheadPlanes on their way to SFO high above, small planes circling the Palo Alto and San Carlos airports, and a hot-air balloon over the bayfront.
- Ducks and boatsDucks on the Duck Pond and boats on Redwood Creek.
- Life on the streetCars stopping at the lights, buses on their real routes, cyclists in the bike lanes and people waiting to cross. The fire truck button sends an engine out of the nearest station, lights and siren on.
- Night falls for realIn Realtime, the street lamps come on after sunset, traffic rises and falls with the hour, and the city’s parking lots empty out between 2 and 5 a.m., when parking there isn’t allowed. Tap the clock under Filter to see the city at any hour, night included.
- Three proposals for downtown’s parking plazasTap Parking Plaza 1, 2 or 3 and pick a proposal: that team’s buildings, traced from its plans, go up on all three. All three proposals are before the City Council.
- A crane at 320 Sheridan DriveWhere new homes are going up.
- Any building’s addressTap a building to see its address and the businesses inside, or use Find to fly to your street.
- Just watch, with musicTap the eye button to hide the menus and watch the city go by. The ♪ button plays one of four original stations, from lo-fi to soft piano.
What this simulator leaves out
Zoning isn’t building. Zoning a site means homes would be allowed there, not that they get built. A real plan also has to show each site can realistically be built on, with the right zoning, roads, water and sewer; the state checks all of that. This simulator only counts homes.
The slider keeps it simple. It changes how many homes a site is zoned for, evenly across its income levels; real developments vary. The state counts a site at what its zoning realistically allows, not at the extra homes a developer can add under the state’s density bonus law, so sliding above “As planned” stands for the city rezoning the site. Switching an income level off moves its homes to market rate when market rate is on. Building heights on the plan’s sites are our rough estimate from homes per acre.
Fee waivers are a rough stand-in. On private land, each affordable home beyond what the city’s below-market-rate (BMR) rule already requires is counted at about $31,737, the development fees on a new apartment in the plan’s fee table (school and sewer fees among them), as if they were waived. Real deals use other tools too.
Two totals for the sites. Each site’s homes come from the plan’s site list. The plan’s summary table counts 17 of those lower-income homes as moderate income, because they sit on parcels under half an acre, so its lower-income total for the sites is 1,514, while the list adds up to 1,531.
Each income group stands on its own. Extra homes for lower incomes don’t fill a shortfall of moderate-income homes. State law sorts a plan’s sites into three groups, lower income (very low and low together), moderate and above moderate (Gov. Code 65583.2(c)), and the city has to keep enough sites for each one (no net loss). The state’s yearly progress reports count each level separately too: “excess units in one income category do not count toward the higher-income category” (HCD). The one exception, in the state’s check for faster approvals, lets extra very low-income permits count toward low (HCD’s guidelines). A city does choose which group each site’s homes count toward when it writes its plan; the simulator keeps the levels Menlo Park’s plan chose.
Sources (32)
- Menlo Park 2023-2031 Housing Element (certified): the targets and the 30% margin, Table 7-1
- The same plan: the land inventory summary, Table 7-4 (the sites’ totals)
- City of Menlo Park, 2025 Housing Element Annual Progress Report (March 24, 2026): building permits issued so far, where the simulator starts
- The same plan: the summary of fees, Table 5-5 (the fee waivers)
- The same plan: the site list, Appendix 7-1, Table B
- The same plan: a sheet for each site, Appendix 7-5
- The same plan: Program H4.G, the downtown parking lots
- City Attorney’s impartial analysis of Measure P
- Strategic Economics’ review of the three downtown-lot proposals (Sept. 29, 2026), the funding gaps
- City of Menlo Park, impact fee (AB 1600) report, Jan. 13, 2026: the below-market-rate housing fund
- City of Menlo Park, 2026 call for affordable housing proposals (NOFA), Oct. 13, 2026
- California Tax Credit Allocation Committee, Oak Gardens staff report (2024): cost per home
- Keyser Marston, housing needs assessment for Menlo Park (2021): office workers per square foot
- City of Menlo Park, commercial development BMR requirements: the housing fee on new offices
- City of Menlo Park: builder’s remedy applications
- Gov. Code 65589.5, the Housing Accountability Act (builder’s remedy)
- Gov. Code 65863, no net loss
- Gov. Code 65583.2(c), sites sorted into lower, moderate and above moderate income
- California Department of Housing and Community Development (HCD), Annual Progress Report FAQ (January 2026), p. 13: extra homes in one income level don’t count toward another
- HCD, Streamlined Ministerial Approval Process Guidelines (March 30, 2021), section 200(e): extra very low-income permits count toward low
- HCD, Housing Element Site Inventory Guidebook (June 10, 2020): very low and low counted together as lower income
- Gov. Code 65915, the state density bonus
- San Mateo County parcel map: where each site is, and the street address of each building you tap
- City of Menlo Park urban forest inventory (West Coast Arborists, April 2026): the street trees on the map, their kind and height
- Willow Village master plan (Conditional Development Permit, Oct. 19, 2022): its buildings as approved, outline and height of each part
- Federal Highway Administration, Travel Monitoring Analysis System (California's urban count stations, October 2019): how much traffic is out each hour on Realtime, freeways and streets, weekdays and weekends
- Caltrans Traffic Census, peak hours: which way the commute runs on 101, Bayfront Expressway and University Avenue
- FEMA and Oak Ridge National Laboratory, USA Structures: how tall each building on the map measures (from lidar), so houses show one story or two as they really are
- City of Menlo Park GIS, street improvements and pavement (October 2026): how wide each street in the city is, curb to curb, measured every 6 to 10 m; its lanes, turn lanes, parking and bike lanes from OpenStreetMap
- U.S. Geological Survey, 3D Elevation Program (lidar flown 2020 and 2023): how high the overpasses and their ramps stand, how deep 101, El Camino Real and University Avenue dip under the railways and streets that cross them, and how deep San Francisquito Creek and the Atherton Channel run below their banks
- Federal Highway Administration, National Bridge Inventory (June 2025): each bridge’s clearance over the road below, to check the overpasses’ heights; the pedestrian bridges are estimates from Caltrans’ clearance standard
- OpenStreetMap contributors (ODbL): the map’s scenery (streets, traffic lights, stop and speed limit signs, other trees, lamps, parks, schools, bus routes and more), the businesses and landmarks named on the map, and the businesses named when you tap a building