
Appendix B
Methods and sources
The book’s data holds 157 figures, each with its badge.
The measures, how each is taken
1.1 Residents within a 10-minute walk of a City park
Share of residents (2020 Census) whose walk along streets and paths to a City park's edge is half a mile or less.
Citywide. District 1: 72.0%; Belle Haven: 73.4%. ParkServe, which also counts parks the City does not own, reports 80%.
1.2 Same, counting school fields open to the public and other public parks
As 1.1, with the school sites the City shares by agreement and parks run by other agencies.
Citywide. In District 1, 95.1% with the Belle Haven School field and 78.0% while it is closed for school construction.
1.3 Residents outside the walk near Willow and Pierce roads
People in the Census block group around Carlton, Madera, Sevier, Willow and Pierce who are more than a 10-minute walk from a City park.
Of 2,049 residents in that block group, the largest gap the analysis found in District 1. The planned Willow Road pocket park sits in it.
1.4 Acres of City parkland per 1,000 residents
City GIS park area divided by population (2020 Census).
225.8 acres of City park outlines for 33,800 residents.
The 2019 plan counted 6.48, against the City's standard of 5.0. Without Bedwell Bayfront Park, 1.85.
2.1 Kelly Park field and track: age against expected life
Years since the surface was installed, against the 8 to 10 years synthetic turf is expected to last.
2026 minus 2010, the year staff give for the last renovation (the 2019 plan says 2011).
In April 2023 staff said the turf, track and exercise stations had reached the end of their serviceable life.
2.2 City parks scored each year on a standard condition form
One walk a year per park on a published form, with scores posted per park.
No park-by-park condition score is published yet.
2.3 Park assets with a published install year, condition and expected life
Share of the City's park asset records (Cartegraph) that carry all three, published by park.
These records are in Cartegraph and are not yet published.
2.4 Condition index for buildings and pools
Deferred repair cost divided by replacement cost (the Facility Condition Index): under 0.05 good, over 0.10 poor.
The inputs belong in Cartegraph and are not yet published.
3.1 Field use: reserved hours as a share of available hours
All City-scheduled fields, 12 months to October 2026, from the City's monthly statistics.
15,449 reserved of 109,320 available hours, Nov. 2025 to Oct. 2026.
The City’s tables do not define "available hours."
3.2 Hours lost to closures
Field and court hours closed for maintenance, weather or construction, by month.
4.1 Recreation accounts
Accounts in the City's registration system, all sites, a running total.
Up from 19,529 in October 2025.
4.2 Participants by neighborhood, waitlists and scholarships
Program registrations summed by neighborhood (no names), with fill rates and scholarship use.
The City publishes enrollment by site, not yet by neighborhood.
5.1 Park irrigation controllers replaced with smart controllers
Count of park irrigation controllers on the new system.
Under a January 2026 contract ($274,600), 18 of the 34 controllers that serve the City's recreational spaces are being replaced, at 10 parks and 7 City buildings; staff put them at 26 years old. Completion by site is not yet published.
5.2 Water used per irrigated acre
Metered park water use divided by irrigated area, by park.
6.1 Parks capital dollars on hold
Budget of parks projects marked "On hold" as a share of the parks capital budget.
$4,175,167 of $10,629,233: four of ten projects.
The four are on hold, in the City's words, "Delayed to staffing capacity."
6.2 2019 recommendations placed by status from public records
Rows of the 2019 register with a status backed by a City record.
49 of 122 rows placed; 73 are unknown from public records. Each row cites its own record (the tracker).
K2.2 CPP020: next published milestone
The next dated step (bid, award, opening), and every schedule change logged with its reason.
On hold since FY 2025-26. Next milestone not yet published.
K2.3 CPP020: budget against spending
Budget by year and fund, and spending to date, from the City's financial system.
$2,003,177 (FY 2025-26) plus $500,000 added for FY 2026-27, if the first carries forward. The 2023 estimate was $1.8 to $2 million before shade was added.
Spending to date: not yet published.
K2.4 Field use, October 2026
Reserved hours as a share of available hours, as the City printed it.
As printed; 365 of 840 hours computes to 43.5%. October 2025: 36%.
K2.5 Resident-reported problems at the park
Service requests placed in the park by hand, from the City's feed: what was reported and what was done, with the median days to close.
Requests since Nov. 2020 checked one by one; 12 repair requests in 2026 are pinned on the courts and field with no description.
A1 2019 recommendations with a known status
Rows of the 2019 register for this site whose status a City record shows.
5 of 12: 1 done or partly done, 3 under way, 1 ongoing, 0 not started.
A2 Field use, last 12 months
Reserved hours as a share of the hours the City lists as available.
5,692 of 28,834 hours.
A3 Service requests in the last 12 months
Distinct requests in the City's public feed for this site (see How the numbers work).
49 since November 2020; 18 still open.
Median 3 days to close.
Walk access
Within a 10-minute walk: 805 m (half a mile) along streets and paths (OpenStreetMap) to within 30 m of a park’s edge. People: 2020 Census, spread over the City’s residential addresses. Parks: the City’s map. ParkServe (Trust for Public Land) reports 80%; it also counts parks the City does not own.
Service requests
The City’s public Cartegraph layer repeats requests: 2,309,203 rows for 15,442 requests on Nov. 16, 2026. Each request is counted once, for the place it names or, if none, the park outline it is in or within 10 m of. It keeps counts, with no request numbers, addresses, notes or names.
Field and court use
Reserved hours divided by available hours, from the City’s monthly tables. The City does not yet define available hours, and a few printed percentages differ from the division.
Trends (Part IV)
Source: Attachment A of the "Library and Community Services department statistics" staff report in each Parks and Recreation Commission packet, 34 packets from June 2023 to November 2026 (35 reports; the July 2025 packet carries two). The first, for May 2023, starts in January 2023; no earlier packet carries monthly statistics (2018 to 2022 packets have the aquatics operator's yearly reports and one-time tables).
Reading: each PDF's tables are read by word position (scripts/parks-trends.py), 59,022 printed cells in all. A month or season is printed in up to 14 packets; the latest printed number is kept. 177 of the 2,710 values were printed differently in an earlier report: a season or month still in progress, a correction the City noted (lunches in September 2024), or a changed cell. Every change is listed in the research notes. A period with nothing printed stays blank; nothing is filled in.
Definition changes, shown apart and never joined: classes, gymnastics, sports, drop-in visits, leagues, senior classes, facility rentals and field hours were season totals (Winter 2022-23 to Spring 2025) until the August 2025 statistics, which count them by month from July 2025; room, court, picnic and park hours start then. The Senior Center's classes were printed under 700 Alma St. until the center moved to 100 Terminal Ave. (April and May 2024); after that, 700 Alma St. is the Arrillaga Family Recreation Center's classes for older adults. From July 2025 the after-school totals include summer camp, which the City lists apart. The first two reports counted field hours for January to May 2023, later reprinted as Winter 2022-23.
This plan's arithmetic, marked "computed": totals of residents and non-residents; reserved hours divided by available hours; the eight courts added up; summer concerts added up by year. Monthly class enrollment counts each class's enrollment each month; it is not a count of different people. Event attendance is as the City prints it; names changed (Halloween Hoopla, then Halloween Parade and Festival) and are shown under one row. Tennis classes use the youth and adult rows: the City's total and residency rows do not add up to them (September 2025: total 30; youth 47 and adult 24), and some reports print one value fewer in those rows.
Left out: the library tables the City publishes in the same attachment (circulation, cards, holds, visits, library programs), a different service. Pool visits are not in the monthly statistics; the aquatics operator reports them yearly (Part III, Pools). Coverage: Jan. 2023 to Oct. 2026.
Estimates
An item with no published install year takes the park’s last renovation year from the 2019 plan. Expected lives use the City’s standard where it has one (courts: 12 years), common planning ranges otherwise. A window built on an estimate is marked.
Each part of the plan: the proposed method
- Setup and management: The register and this site as the project plan; monthly Commission check-ins
- Population and growth: 2020 Census, yearly Census surveys and the Housing Element; a first draft by AI, checked by staff
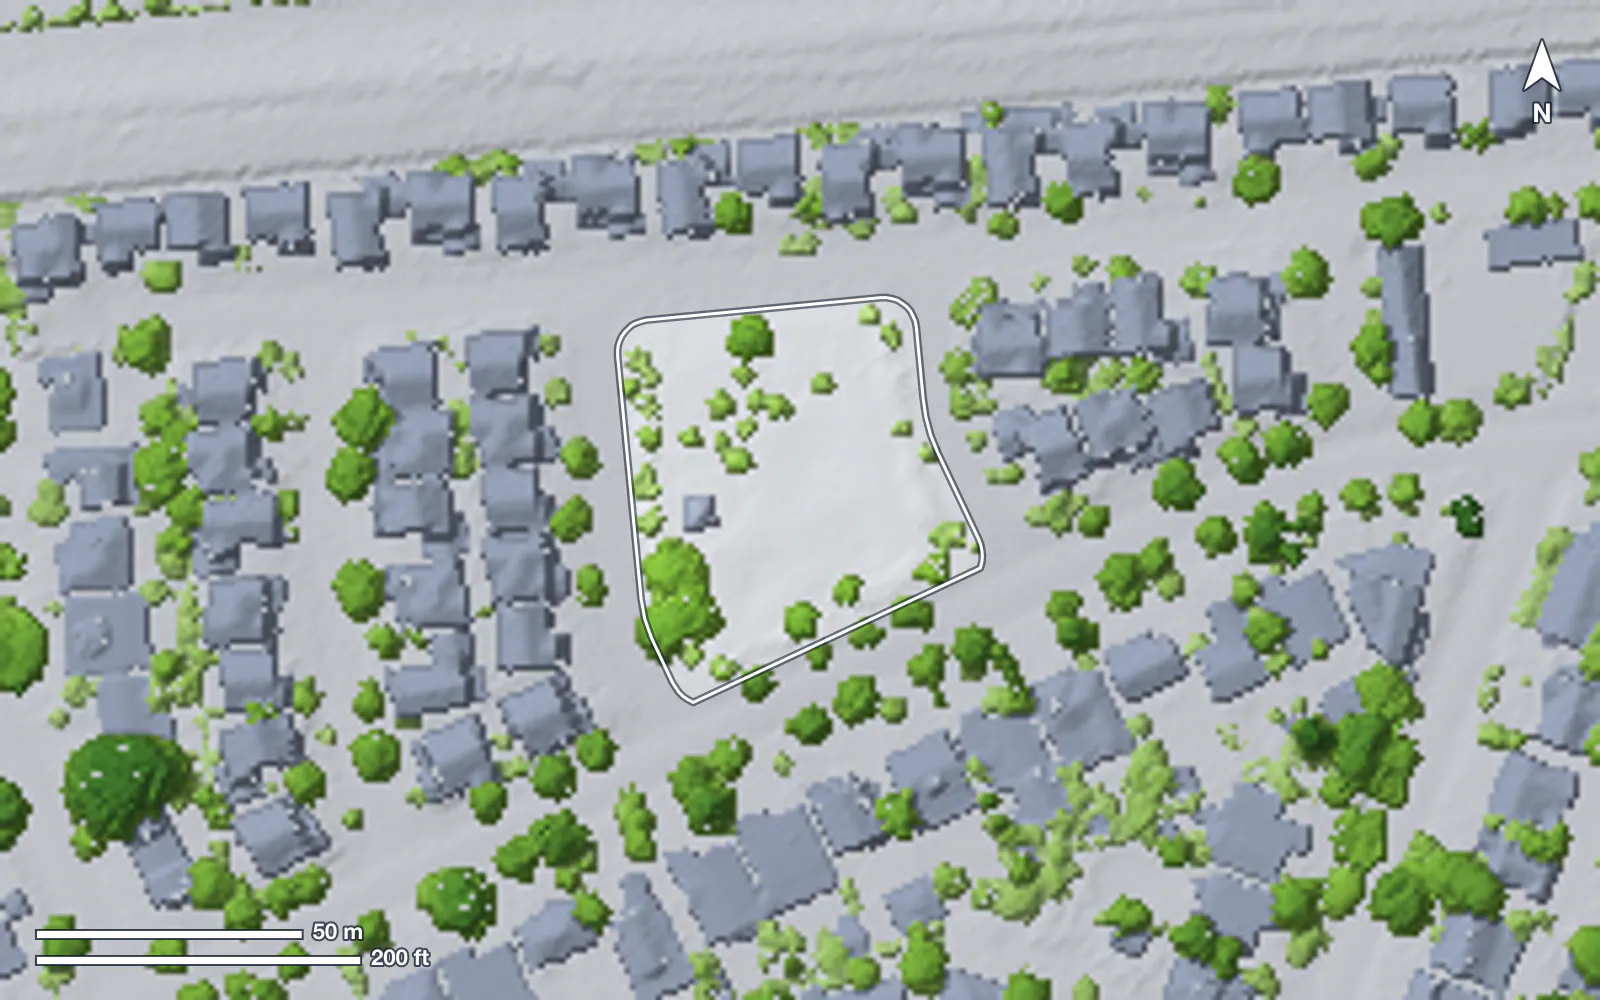
- Inventory and condition: City GIS, a Cartegraph export, lidar and aerial photos (the Kelly Park method), and one walk per park on a standard form
- Use and programs: Monthly PerfectMind exports, the ones behind the City's statistics tables
- Access and level of service: A walk-time analysis on open data (the method under Walk access, above)
- Comparison with other cities: The national park agency database (NRPA Park Metrics), with the City's own data entered
- Community input and needs survey: An online page, the 2025 staff survey as the baseline, booths at City events in English and Spanish, AI-assisted sorting of comments checked by staff, and a statistically valid survey if the City wants one
- Goals and standards: The 2019 guidelines as the base, revised against the new data by a Commission subcommittee
- Recommendations and priorities: Re-run the 2019 scoring on the register, in public; the KPI gaps set the order
- Costs and funding: Unit costs from the City's own recent bids and peer cities' bids; OpenGov for funding; an outside estimator for the top-ranked projects
- Writing it, and this website: Drafts with AI help from the register and data, edited by staff; a web plan in English and Spanish
- Review and adoption: Standard staff reports and a Council study session
AI in this work
AI tools were used to gather sources and draft text for this proposal. Each figure was checked against its linked source.
Every source
City records
- 2019 Parks and Recreation Facilities Master Plan (accepted Oct. 15, 2019)
- City page for the master plan, with its Tier 1 status table (updated April 29, 2025)
- Parks and Recreation Commission packet, Oct. 28, 2020: update on the 14 Tier 1 projects
- Staff Report 17-253-CC: the 2019 plan's consultant agreement
- Staff Report 18-203-CC: first amendment to the plan agreement
- Staff Report 19-100-CC: second amendment to the plan agreement
- Staff Report 18-028-CC: community outreach plan for the master plan
- Staff Report 18-110-CC: Jack Lyle Park restroom construction
- Staff Report 22-172-CC: Meta's contribution to the Community Campus, about $40 million
- Staff Report 22-079-CC: FY 2022-23 capital program direction
- Staff Report 23-024-CC: adopting the 2023-2031 Housing Element, with its environmental findings and their ratio of 2.57 persons per household (Jan. 31, 2023)
- Environmental Quality Commission minutes, Jan. 15, 2025 (artificial turf)
- Staff Report 23-093-CC: Kelly Park turf and track update
- Staff Report 23-164-CC: Willow Oaks and Burgess construction contract
- Staff Report 26-009-CC: smart irrigation controllers at 17 City sites (Jan. 27, 2026)
- Staff Report 26-001-CC: development impact and in-lieu fees as of June 30, 2025, with the next playgrounds to replace (Att. H) (Jan. 13, 2026)
- Staff Report 26-053-CC: capital program status, FY 2025-26 (April 14, 2026)
- Staff Report 26-081-CC: direction on the five-year capital plan (May 12, 2026)
- Staff Report 26-103-CC: public hearing on the proposed FY 2026-27 budget (June 9, 2026)
- Five-year capital plan descriptions, Planning Commission, May 20, 2024
- City project page: Kelly Park Turf and Track Replacement
- Parks and Recreation Commission packet, Oct. 23, 2024: Kelly Park update
- Joint Library and Parks commissions packet, May 28, 2025: the 2025 community survey
- Parks and Recreation Commission packet, Oct. 22, 2025: projects completed under the plan
- Parks and Recreation Commission packet, July 22, 2026: tentative calendar
- Parks and Recreation Commission packet, Sept. 23, 2026: the 2026-27 work plan
- Parks and Recreation Commission packet, Nov. 18, 2026: October 2026 statistics
- City page: Belle Haven School field
- City page: Kelly Park
- Council Policy CC-24-004 (adopted Feb. 13, 2024, Resolution No. 6890): commissions and staff time, as attached to Staff Report 26-140-CC (Aug. 25, 2026)
- Staff Report: Cartegraph asset management (Jan. 15, 2019)
- Staff Report: PerfectMind registration and reservations (March 8, 2022)
- Staff Report: OpenGov budget and financials (Sept. 22, 2020)
- Parks and Recreation Commission packet, July 24, 2024: the Community Campus opening
- City Council minutes, May 12, 2026
- City Council minutes, July 14, 2026
- City GIS: park outlines (Menlo_Park_Parks layer)
- City's public Cartegraph service-request feed
- Staff Report 26-027-CC: the 2025 aquatics annual report and an independent financial review of the pool operator (City Council, Feb. 24, 2026)
- Staff Report 26-028-CC: FY 2025-26 mid-year budget amendments (City Council, Feb. 24, 2026)
- Staff Report 21-050-CC: the cost recovery policy, library fines and recreation fees, with revenue and spending by program for FY 2018-19 and 2019-20 (City Council, April 13, 2021)
- City Council minutes, April 13, 2021 (cost recovery policy direction)
- City of Menlo Park Budget 2023-24 (adopted June 27, 2023): revenue and spending by division, with actuals for FY 2019-20 to 2021-22
- The City's online budget (OpenGov): Library and Community Services and Public Works revenue and spending by division, all funds, FY 2022-23 actuals to the FY 2026-27 adopted budget (read Nov. 16, 2026)
- Staff Report 26-057-CC: the master fee schedule, with the 2026 Comprehensive User Fee Study (full cost and revenue for 39 recreation and library fee categories) (April 28, 2026)
- Staff Report 26-114-CC: adopting the FY 2026-27 budget (June 23, 2026)
- Staff Report 26-117-CC: gymnastics program fees (July 14, 2026)
- City Council minutes, Aug. 25, 2026, with the Menlo Children's Center cost recovery presentation
- Staff Report 26-178-CC: updating the user fee cost recovery policy (Oct. 27, 2026)
- User Fee Cost Recovery, City Council Policy CC-26-025 (adopted Oct. 27, 2026, Resolution No. 7063)
- City Council minutes, Sept. 9, 2025, with the aquatics operating options presentation
- Parks and Recreation Commission packet, Feb. 25, 2026: the pool operator's 2025 annual aquatics report
- Public budget workshop, FY 2026-27 (May 28, 2026): Library and Community Services highlights for FY 2025-26
- Parks and Recreation Commission packet, June 28, 2023: May 2023 statistics (Staff Report PRC-2023-020, Att. A), pp. G-1.4 to G-1.6
- Parks and Recreation Commission packet, July 26, 2023: June 2023 statistics (Staff Report PRC-2023-023, Att. A), pp. F-1.4 to F-1.6
- Parks and Recreation Commission packet, Sept. 27, 2023: August 2023 statistics (Staff Report PRC-2023-031, Att. A), pp. F-1.3 to F-1.5
- Parks and Recreation Commission packet, Nov. 15, 2023: October 2023 statistics (Staff Report PRC-2023-034, Att. A), pp. D-1.3 to D-1.5
- Parks and Recreation Commission packet, Jan. 24, 2024: December 2023 statistics (Staff Report PRC-2024-004, Att. A), pp. F-2.5 to F-2.7
- Parks and Recreation Commission packet, Feb. 28, 2024: January 2024 statistics (Staff Report PRC-2024-006, Att. A), pp. D-1.5 to D-1.7
- Parks and Recreation Commission packet, March 27, 2024: February 2024 statistics (Staff Report PRC-2024-009, Att. A), pp. F-2.5 to F-2.9
- Parks and Recreation Commission packet, June 26, 2024: May 2024 statistics (Staff Report PRC-2024-022, Att. A), pp. F-2.4 to F-2.7
- Parks and Recreation Commission packet, July 24, 2024: June 2024 statistics (Staff Report PRC-2024-025, Att. A), pp. G-2.4 to G-2.7
- Parks and Recreation Commission packet, Aug. 28, 2024: July 2024 statistics (Staff Report PRC-2024-031, Att. A), pp. E-2.5 to E-2.8
- Parks and Recreation Commission packet, Sept. 25, 2024: August 2024 statistics (Staff Report PRC-2024-033, Att. A), pp. F-2.4 to F-2.7
- Parks and Recreation Commission packet, Oct. 23, 2024: September 2024 statistics (Staff Report PRC-2024-035, Att. A), pp. D-2.6 to D-2.9
- Parks and Recreation Commission packet, Nov. 20, 2024: October 2024 statistics (Staff Report PRC-2024-039, Att. A), pp. D-1.5 to D-1.7
- Parks and Recreation Commission packet, Jan. 22, 2025: December 2024 statistics (Staff Report PRC-2025-002, Att. A), pp. E-1.5 to E-1.8
- Parks and Recreation Commission packet, Feb. 26, 2025: January 2025 statistics (Staff Report PRC-2025-003, Att. A), pp. D-2.7 to D-2.10
- Parks and Recreation Commission packet, March 26, 2025: February 2025 statistics (Staff Report PRC-2025-005, Att. A), pp. F-1.5 to F-1.8
- Parks and Recreation Commission packet, April 23, 2025: March 2025 statistics (Staff Report PRC-2025-010, Att. A), pp. E-3.5 to E-3.8
- Parks and Recreation Commission packet, May 28, 2025: April 2025 statistics (Staff Report PRC-2025-013, Att. A), pp. D-1.6 to D-1.9
- Parks and Recreation Commission packet, June 25, 2025: May 2025 statistics (Staff Report PRC-2025-017, Att. A), p. F-2.5
- Parks and Recreation Commission packet, July 23, 2025: May 2025 statistics (with the June 25 minutes, item E-1) and June 2025 statistics (Staff Report PRC-2025-020, Att. A), pp. E-1.4 to G-1.10
- Parks and Recreation Commission packet, Sept. 24, 2025: August 2025 statistics (Staff Report PRC-2025-028, Att. A), pp. F-2.6 to F-2.12
- Parks and Recreation Commission packet, Oct. 22, 2025: September 2025 statistics (Staff Report PRC-2025-031, Att. A), pp. F-1.6 to F-1.15
- Parks and Recreation Commission packet, Nov. 19, 2025: October 2025 statistics (Staff Report PRC-2025-037, Att. A), pp. D-3.5 to D-3.12
- Parks and Recreation Commission packet, Jan. 28, 2026: December 2025 statistics (Staff Report PRC-2026-003, Att. A), pp. E-2.6 to E-2.14
- Parks and Recreation Commission packet, Feb. 25, 2026: January 2026 statistics (Staff Report PRC-2026-006, Att. A), pp. F-2.5 to F-2.12
- Parks and Recreation Commission packet, March 25, 2026: February 2026 statistics (Staff Report PRC-2026-009, Att. A), pp. F-2.5 to F-2.14
- Parks and Recreation Commission packet, April 22, 2026: March 2026 statistics (Staff Report PRC-2026-013, Att. A), pp. G-2.5 to G-2.13
- Parks and Recreation Commission packet, May 27, 2026: April 2026 statistics (Staff Report PRC-2026-017, Att. A), pp. F-1.5 to F-1.13
- Parks and Recreation Commission packet, June 24, 2026: May 2026 statistics (Staff Report PRC-2026-021, Att. A), pp. G-1.6 to G-1.13
- Parks and Recreation Commission packet, July 22, 2026: June 2026 statistics (Staff Report PRC-2026-026, Att. A), pp. F-2.5 to F-2.12
- Parks and Recreation Commission packet, Aug. 26, 2026: July 2026 statistics (Staff Report PRC-2026-029, Att. A), pp. F-1.6 to F-1.14
- Parks and Recreation Commission packet, Sept. 23, 2026: August 2026 statistics (Staff Report PRC-2026-035, Att. A), pp. F-3.5 to F-3.13
- Parks and Recreation Commission packet, Oct. 28, 2026: September 2026 statistics (Staff Report PRC-2026-039, Att. A), pp. E-1.5 to E-1.11
Outside sources
This plan’s own analyses
- The 2019 plan's recommendations as a register made for this plan, each status with its City record (Nov. 15, 2026)
- Walk-access analysis made for this plan: City GIS parks, 2020 Census, OpenStreetMap walking network (Nov. 16, 2026)
- Kelly Park asset inventory made for this plan, from City GIS, lidar, aerial photos and City reports (Nov. 13, 2026)